☁️ AI DevOps Copilot — Building an AI-Powered, Cloud-Native DevOps Platform What if a DevOps platform could…
usama R. — Cybersecurity | Web Application Penetration Tester | Vulnerability Assessment | OWASP Top 10 | Burp Suite Professional
Reshared from a post by Naman Mahna
☁️ AI DevOps Copilot — Building an AI-Powered, Cloud-Native DevOps Platform
What if a DevOps platform could do more than display dashboards—what if it could help engineers investigate failures, understand operational dependencies, and make troubleshooting more intelligent?
That question has been driving the development of my AI DevOps Copilot, a full-stack platform that brings together AI-assisted troubleshooting, CI/CD observability, Kubernetes infrastructure insights, and event-driven incident analysis.
🤖 1. AI-Powered DevOps Assistant
The AI layer uses multiple execution paths rather than relying on a single RAG workflow. Based on user intent, it can:
▪️ Handle conversational queries
▪️ Execute live tools against DevOps and GitHub data
▪️ Retrieve and analyse historical CI/CD failure context through RAG
GitHub Actions logs are processed to extract meaningful failure information, which is transformed into searchable knowledge using Sentence Transformers, embeddings, and Qdrant.
The architecture combines intent classification, live tool execution, historical context retrieval, guardrails, and LLM-generated responses to support more context-aware troubleshooting.
⚙️ 2. Event Engine & Pipeline Intelligence
I’ve also been developing an Event Engine that transforms CI/CD workflow events into pipeline state, performance metrics, and dependency-aware incident insights.
Key engineering implementations include:
▪️ Pipeline State Management — Tracks CI/CD activity using repository and workflow identifiers.
▪️ Sliding Window Event Processing — Uses Python’s collections.deque with a two-hour development window to manage recent events and expire stale data efficiently.
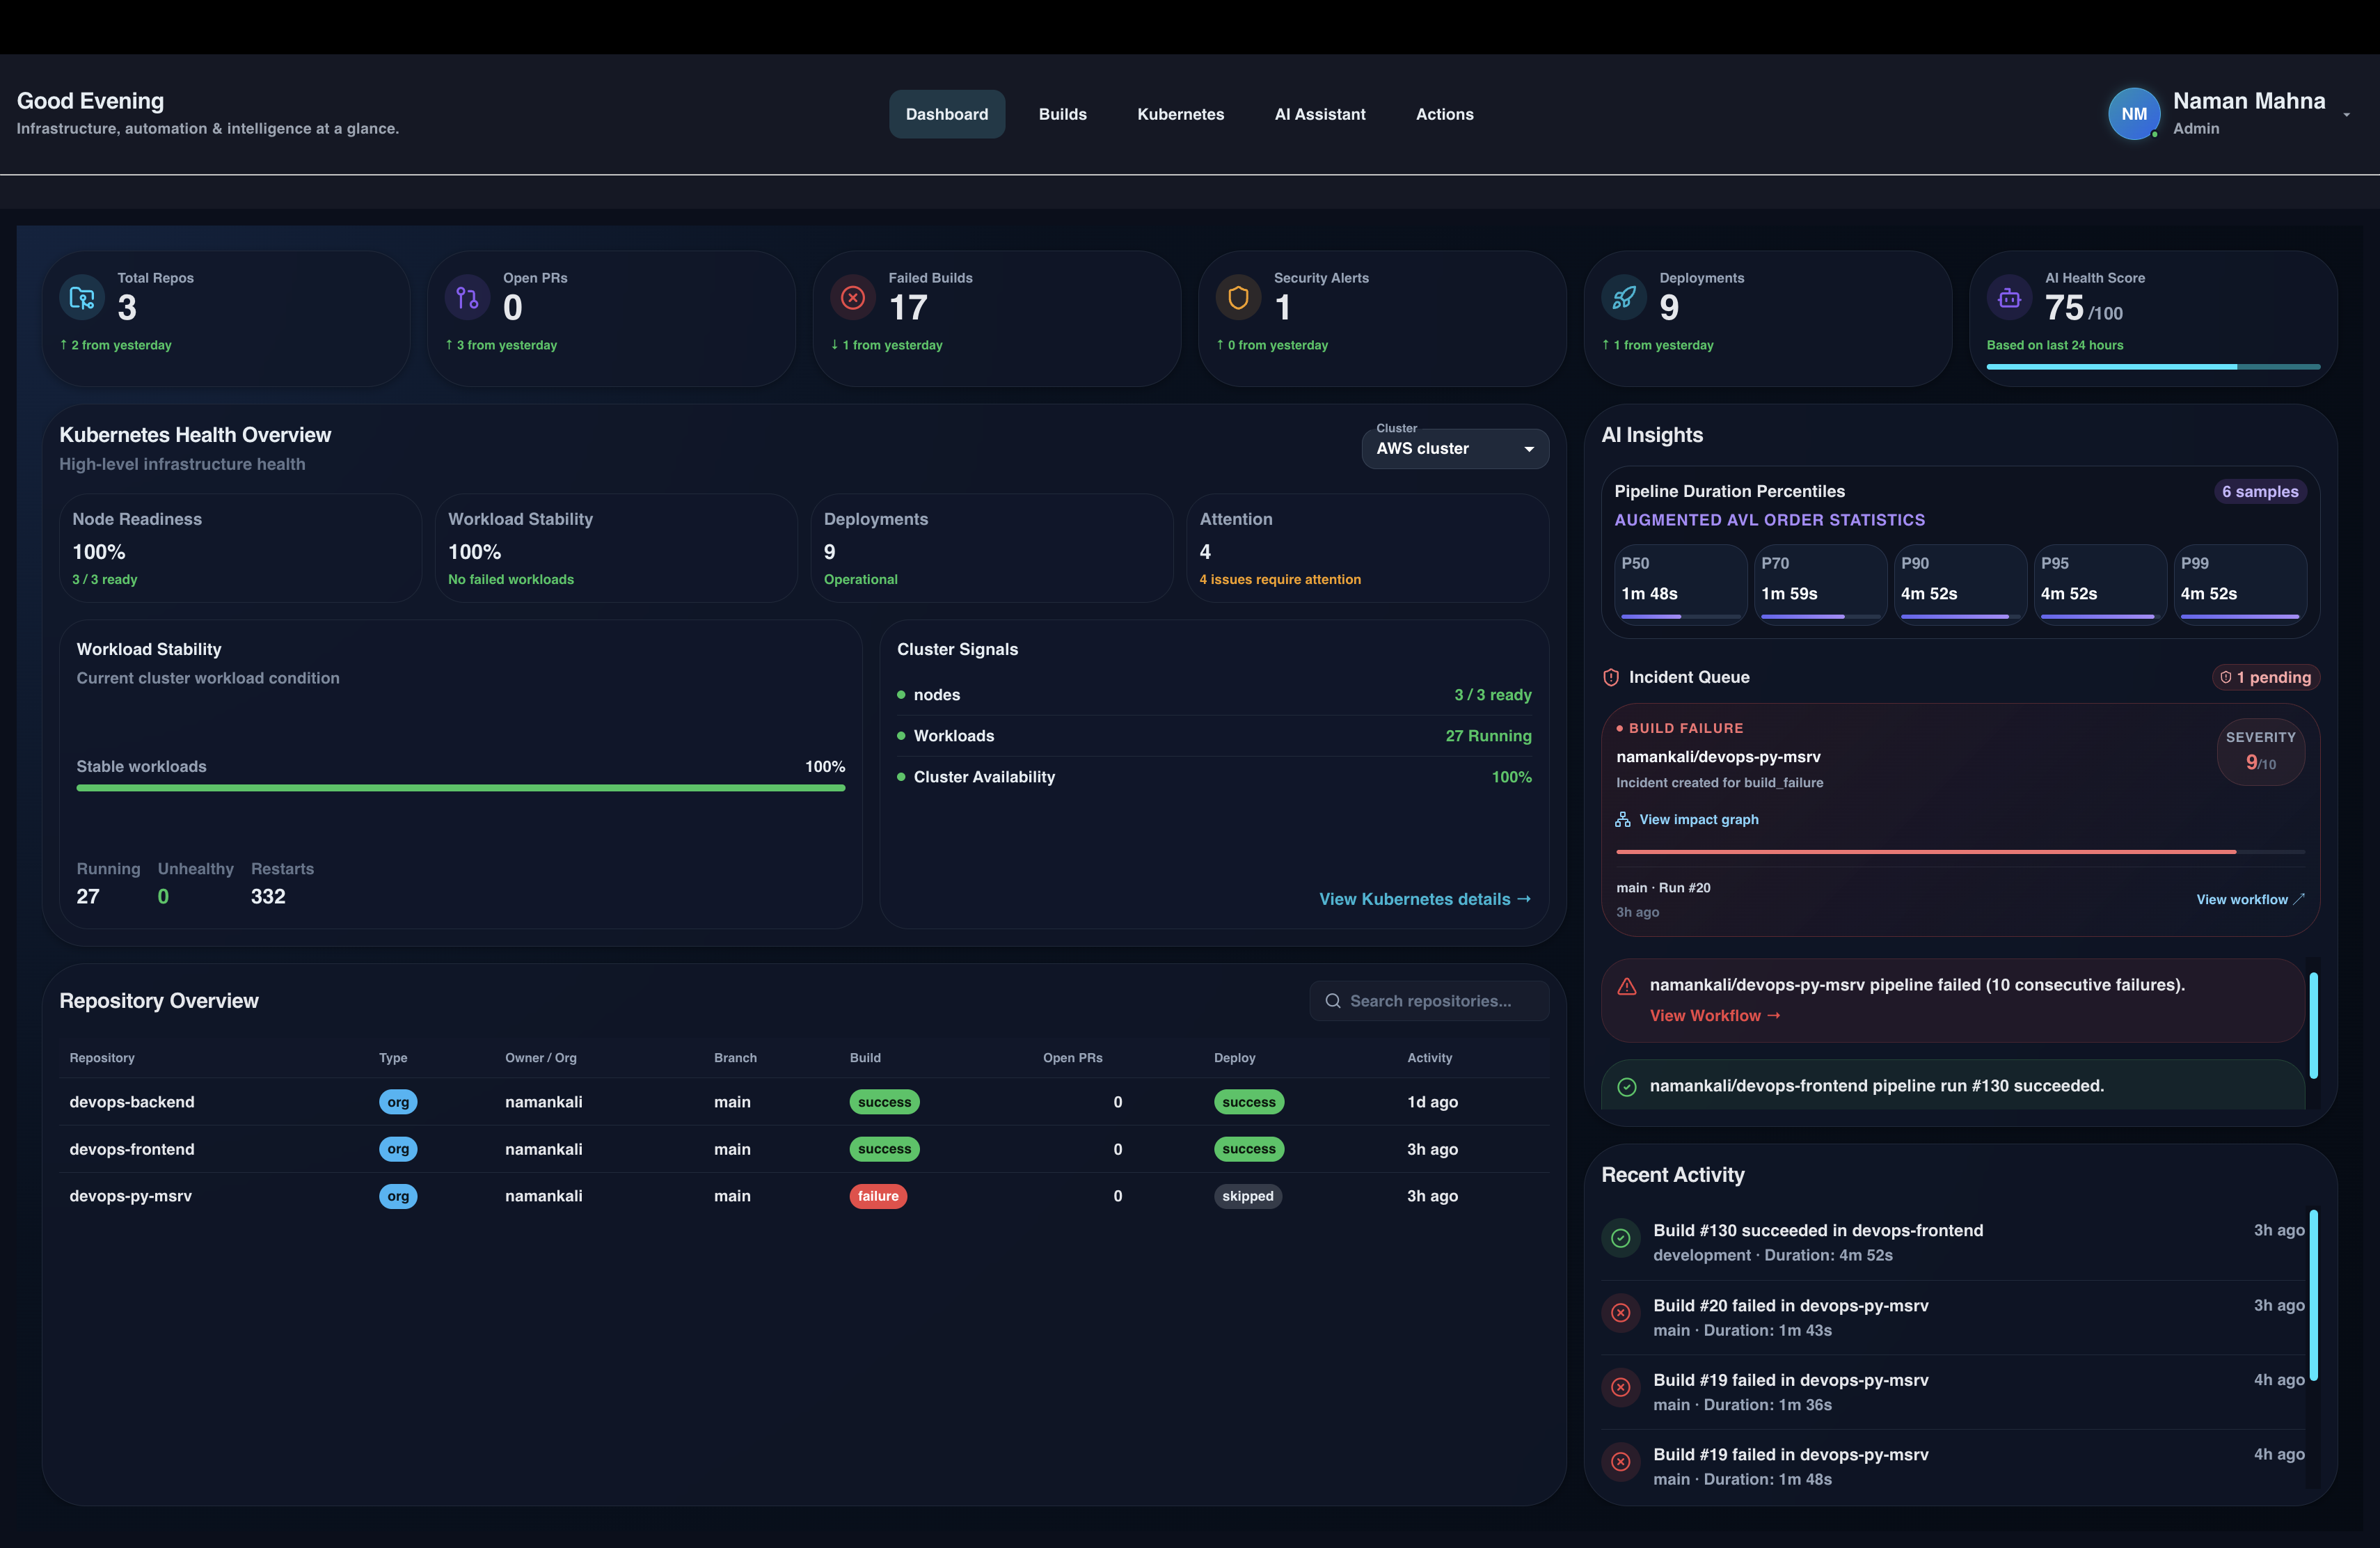
▪️ Percentile Metrics with an Augmented AVL Tree — Uses order-statistic operations to calculate P50, P70, P90, P95, and P99 execution-duration percentiles, providing a more detailed view of pipeline performance than averages alone.
▪️ Severity-Based Incident Processing — Classifies operational events and prioritises failures based on severity.
▪️ Runtime State Recovery — Restores recent pipeline state and dependency topology during startup.
▪️ Deployment Target Mapping — Connects repositories, workflows, and branches to their configured Kubernetes clusters and services.
▪️ Dependency-Aware Impact Analysis — Uses Kubernetes service dependency graphs, adjacency structures, and reverse-adjacency traversal to identify potentially affected downstream services.
The objective is to connect CI/CD events with infrastructure relationships and provide more useful context when investigating operational failures.
📊 3. Full-Stack DevOps Platform
The platform brings together several operational views:
▪️ Dashboard: Repository, build, deployment, and AI health insights.
▪️ CI/CD: Workflow runs, jobs, branches, failures, success rates, and execution durations.
▪️ Kubernetes: Visibility into workloads, services, networking resources, configuration, storage, events, and resource usage.
▪️ AI Assistant: An interactive interface combining live operational data with historical failure context.
▪️ AI Health: Monitoring dimensions including provider and model availability, inference success, latency, and tool reliability over a 24-hour window.
🛠️ Technology Stack
Frontend: React, Vite, TypeScript
Backend: Node.js, TypeScript
Database: PostgreSQL
Asynchronous Processing: Redis, Bull
AI Services: Python, FastAPI
LLMs: Ollama (local), OpenAI API
Vector Database: Qdrant
Infrastructure: Docker, Kubernetes, K3s, AWS EC2
The platform currently runs across my local Kubernetes environment and AWS EC2-based K3s infrastructure.
🔐 4. Reliability, Security & What’s Next
The next phase focuses on strengthening the platform through:
▪️ Concurrency validation and load testing
▪️ Improving event-processing reliability and recovery behaviour
▪️ Continuous security testing and penetration testing across APIs, infrastructure, containers, and exposed interfaces
▪️ Further development of AI-assisted troubleshooting and operational reasoning
▪️ Progress towards an AWS EKS deployment
The broader engineering challenge is to make these components work together reliably—not simply to add AI to an existing dashboard.
For me, this project is about combining data structures, backend engineering, AI, infrastructure observability, and security into a platform that can help engineers move from detecting an operational problem towards understanding its context and potential impact.
More to come. 🚀
#AIDevOps #DevOps #AI #PlatformEngineering #SoftwareEngineering #Kubernetes #AWS #Python #FastAPI #DistributedSystems #Observability #CyberSecurity #DevSecOps
6 reactions · 9 comments
Comments
Schomer: Exceptional backend work, Naman. This dashboard layout is sharp and demonstrates genuine engineering depth far beyond standard static observability tools. As the founder of ETBV, I lean heavily into structural enforcement and system integrity. Your choice to calculate exact percentiles (P50–P99) using an Augmented AVL Tree is a brilliant way to catch the long-tail latency spikes that typical track
Naman Mahna: Schomer Thanks, really appreciate the detailed feedback! The percentile tracking was an interesting part to build using an augmented AVL tree lets me maintain the duration distribution and query P50–P99 without sorting all the samples on every query. On the AI side, one distinction is that intent classification is currently rule-based, rather than delegated to the LLM. Ollama with Qwen2.5:7B is my
Schomer: Appreciate the thorough breakdown, Naman! Decoupling intent classification from the LLM layer using deterministic rules is a sharp architectural choice. It completely neutralizes application-layer prompt injection paths and structural boundary drift at the absolute front of your pipeline, saving significant execution velocity and keeping your P50-P99 latency profile tight by avoiding a probabilist
Naman Mahna: Schomer Thanks for bringing this up! Honestly, I had not considered the possibility of someone manipulating dependency annotations to hide downstream impact, so I have added topology integrity and recovery resilience to my priority list before moving further towards EKS. At the moment the Python service fetches topology through Node.js during startup and rebuilds the graph in memory. I don't have
Schomer: This setup actually provides a perfect use case for an out-of-band validation layout, Naman. The way I approach these kinds of ingestion gaps at ETBV is by dropping a deterministic Layer Zero gateway right between the collection layer (your Node.js service) and the in-memory registry (your Python backend). By routing the raw topology payloads through a pre-execution verification proxy at boot, you